

Your KDP dashboard is a powerful publishing tool, but not every chart or number deserves your daily attention. This guide breaks down which Amazon KDP metrics actually move the needle, and which ones you can safely ignore (or obsess over a little less). Whether you’re a first-time indie author or a seasoned self-publishing pro, knowing how to interpret your KDP data is a must for long-term success.
Table of Contents
- What Is the KDP Dashboard?
- How to Access Your KDP Dashboard
- The KDP Dashboard: Section by Section
- Metrics That Matter
- What You Can Ignore (Most of the Time)
- Case Study: Real-World Dashboard Decisions
- Tips to Use Your Dashboard Like a Pro
- FAQ
What Is the KDP Dashboard?

The KDP dashboard (or “my KDP dashboard” as many authors lovingly call it) is the control center for your Amazon self-publishing empire. It’s where you:
- Publish and price your books 📘
- Track sales, royalties, and page reads 💰
- Access performance data across territories 🌍
- Download reports for deeper insights 📊
Amazon KDP (Kindle Direct Publishing) provides the dashboard free of charge to every author using the platform. Think of it as mission control for your book business.
👉 Access the official KDP dashboard here
How to Access Your KDP Dashboard
Logging in is simple:
- Go to kdp.amazon.com
- Sign in with your Amazon publishing credentials
- Click on “Reports” in the top menu
From there, you’ll land on the KDP Reports tab, aka your KDP Reporting Dashboard.
📌 Pro Tip: Bookmark the Reporting Dashboard URL directly to skip a click!
The KDP Dashboard: Section by Section
Once inside, here’s what you’ll see:
1. Sales Dashboard

What it shows:
- Paid units sold (ebooks, paperbacks, hardcovers)
- Kindle Edition Normalized Pages (KENP) read
- Returns
- Top-performing titles by sales or pages read
Why it matters: This section offers a snapshot of how your books are performing across sales channels and KU. It’s especially helpful for tracking trends post-promo or after a launch. Seeing what’s moving, and what’s not, can help you decide which books deserve a boost, a rebrand, or a sequel.
2. Royalties Dashboard

What it shows:
- Estimated royalties earned
- Filter by marketplace (US, UK, etc.) and format (ebook, paperback, hardcover)
- Currency conversions for international sales
Why it matters: This is your book business bottom line. Keeping tabs on royalty trends over time helps you gauge the ROI of your marketing efforts. A spike? Something worked. A plateau? Time to try a new promo or ad campaign.
3. Historical Reports

What it shows:
- Detailed downloadable reports by month or custom range
- Includes royalties, pre-orders, KENP read, and promo performance
- Available as CSV for spreadsheets or third-party tools
Why it matters: This is where the real data nerds (and spreadsheet lovers) shine. Historical reports let you track long-term trends, compare promo effectiveness month-to-month, and prep for tax season. They’re also great for identifying seasonal patterns in your sales.
4. Promotions Tab

What it shows:
- Upcoming, ongoing, or past Kindle Countdown Deals and Free Book Promotions
- Timing, pricing, and download data for promo periods
Why it matters: This tab helps you correlate specific promotions (like a Freebooksy Email Promo) with spikes in downloads or sales. You can also time your promo stacks with greater precision; essential if you’re stacking promos across different platforms.
Metrics That Matter
Not all data is created equal. These are the MVPs of your Amazon KDP dashboard.
🥇 Pages Read (KENP)
This metric is your Kindle Unlimited heartbeat. A high number of page reads suggests:
- Readers are finishing your book (great for series!)
- Your book may be gaining traction in KU discovery algorithms
- Your writing is resonating with your audience
Fluctuations to watch: A dip in page reads after a promo might indicate the freebie rush is over. A slow, steady rise? That could mean word-of-mouth is working its magic.
🛒 Units Sold
While not every sale tells the full story, units sold show:
- How effective your pricing and marketing is
- Whether your book cover/title is converting browsers into buyers
- Momentum in visibility (e.g., hitting Amazon’s “Also Bought” suggestions)
Fluctuations to watch: A spike after a promo = success. A random surge? Could be an influencer shoutout or a lucky algorithm placement.
💵 Royalties Earned
Royalties offer the truest glimpse into your income, but they also tell you:
- Which formats are working best (e.g., paperbacks outselling ebooks?)
- Whether international pricing tweaks are paying off
- How deep readers are going into your backlist
Fluctuations to watch: Sudden jumps might come from price increases, boxed sets, or KU payouts. Drops? Could be returns, fewer KU reads, or loss of promo momentum.
🌎 Marketplace Breakdown
Seeing your sales split by country can:
- Help you tailor promos to specific markets (e.g., UK-targeted ads)
- Guide pricing experiments (different currencies, VAT)
- Show where to focus efforts for translations or audiobook rights
Fluctuations to watch: A sudden rise in Canada? You may have landed in a regional newsletter or recommendation engine.
📆 30-Day & 90-Day Views
This zoomed-out view reveals your book’s performance rhythm. It helps you:
- Detect if a promo had a long tail (continued reads/sales after Day 1)
- Analyze whether KU reads are compounding across books in a series
- Spot plateaus that might signal reader fatigue or lack of visibility
What You Can Ignore (Most of the Time)
Some metrics look important but often create unnecessary noise or panic.
😬 Returns
Seeing returns can feel personal, but remember:
- They’re often caused by accidental purchases or devices syncing multiple versions
- KU readers may download many books and read selectively
- A few returns aren’t unusual, especially for free books
When to care: If return rates spike right after a promo, it could signal mismatched expectations. Check your blurb, cover, or genre targeting.
⏳ Hourly Sales Tracking
Refreshing your dashboard every hour won’t help sales, but it might raise your blood pressure.
Why it’s safe to ignore: Hourly data is noisy. Reader behavior doesn’t always follow predictable patterns. Better to analyze daily or weekly trends for clarity.
When to care: If you’re mid-promo, a single hourly check can be satisfying, but resist the urge to over-monitor.
🤖 Amazon Rank
It’s fun to see your book climb the charts, but:
- Rank fluctuates constantly and is influenced by competitor activity
- It doesn’t reflect actual revenue or engagement
- High rank ≠ long-term sales
When to care: Use it to celebrate milestone moments, like “Top 100 in Sci-Fi.” Otherwise, let it be background noise.
💼 Lifetime Units
Nice for milestones (“10,000 copies sold!”), but less helpful for decision-making.
Why it’s safe to ignore: It blends all-time data without showing context, like pricing, genre shifts, or promo effort. Focus on the last 30/90 days to plan your next move.
Case Study: Real-World Dashboard Decisions
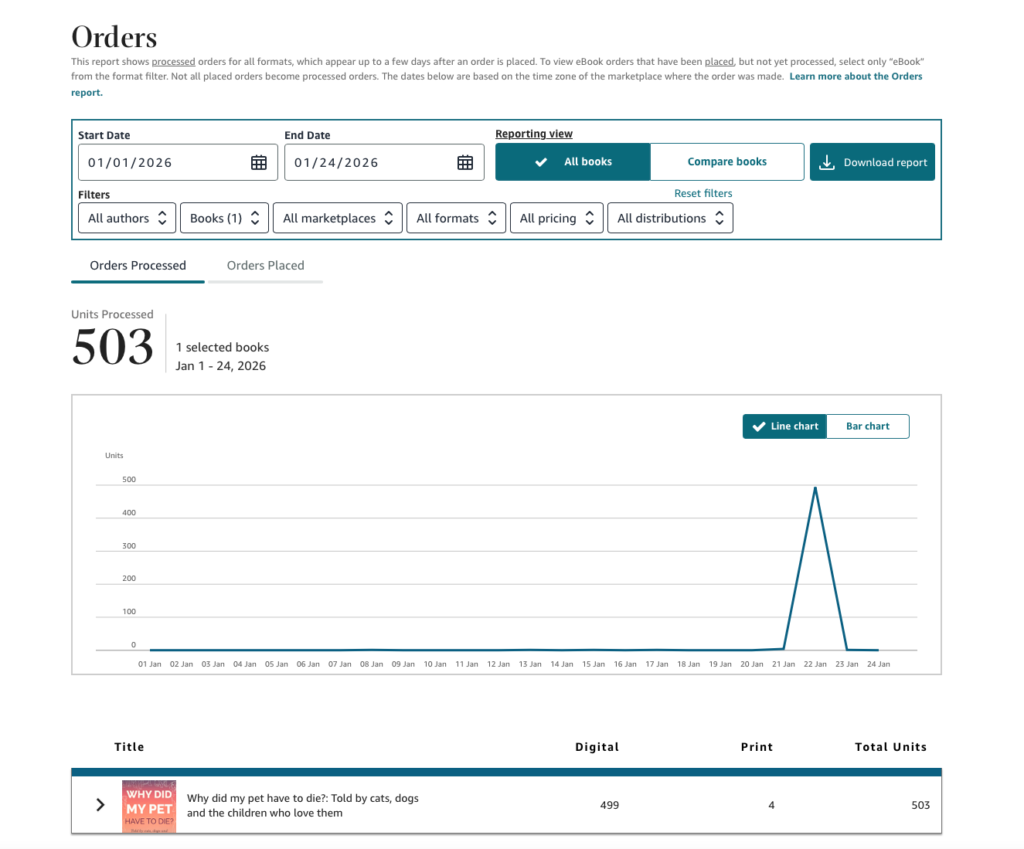
Author: Benjamin Rivers, children’s author
Book: Why Did My Pet Have To Die? (The Turning Point Series, Book 3)
Goal: Drive visibility and downloads for a sensitive, emotionally resonant children’s title
Action Taken:
- Scheduled a Freebooksy Children’s Feature
- Set the ebook price to Free for the promotion
- Promo ran on January 22, 2026
- Promotion cost $45 (member discount applied; $40.50 paid)
- Tracked performance using the KDP Orders dashboard
Results:
- 503 total units processed between Jan 1–24
- ~499 ebook downloads, with the vast majority occurring on the promo day
- Clear single-day sales spike directly aligned with the Freebooksy feature
- Minimal sales activity before and after, indicating a promo-driven surge, not organic drift
Insight: The Freebooksy feature proved effective at generating immediate, concentrated visibility, making it ideal for launches, awareness campaigns, or list-building, but not sustained sales without follow-up marketing.
📚 Moral of the story: A strong promo creates the spike. The dashboard tells you exactly where it came from and what to do next.
Tips to Use Your Dashboard Like a Pro
✅ 1. Review Weekly, Not Daily
Set a standing “CEO meeting” with yourself each week to review key metrics:
- What changed since last week?
- What promos or ads were running?
- Any trends in royalties, reads, or reviews?
📌 This helps you stay strategic, and emotionally steady.
📅 2. Sync With Your Promo Calendar
Track the dates of your:
- Free or Countdown deals
- Email Promos (like Freebooksy or Bargain Booksy)
- Reader Reach Facebook or Amazon Ads
Then compare dashboard spikes or drops around those dates. You’ll quickly learn what works and what doesn’t.
📥 3. Export Data Monthly
Use the Historical Reports tab to download CSVs for:
- Royalties by book and format
- KU reads
- Promo periods
Drop them into a spreadsheet or tools like BookReport to track your performance over time.
🔎 4. Dive Into Marketplaces
Curious about international growth? Filter your dashboard by marketplace. If your books are unexpectedly selling in Germany or Australia, consider:
- Updating metadata with translated keywords
- Running international Facebook Ads
- Checking pricing in local currencies
💬 5. Use the Data to Ask Better Questions
Instead of just “How many books did I sell?” ask:
- “What was my royalty per sale?”
- “How many KU pages did I get per download?”
- “Is one book in my series pulling more weight than the others?”
The dashboard won’t give you all the answers, but it can lead you to the right questions.
FAQ
What do I use my KDP dashboard for?
It’s your publishing command center: track sales, royalties, promotions, and reader engagement, all from one place.
Is my KDP dashboard updated in real-time?
Not quite. There’s often a short delay (up to 24 hours). So don’t panic if your promo results take a day to appear.
Can I see which ad campaign or promo led to a sale?
Not directly, but pairing your KDP data with your promo calendar helps you spot correlations.
How accurate are the royalty numbers?
Royalties shown are estimates and subject to adjustments for returns, exchange rates, and tax withholdings.
How do I know if my promo worked?
Track spikes in page reads, sales, or royalties the day of, and up to 7 days after, a promo. For best results, stack promos like Freebooksy with Reader Reach Ads.
📚 Final Thoughts: Turn Your KDP Dashboard Into a Creative Ally
Your KDP dashboard isn’t just a spreadsheet in disguise; it’s a storytelling tool for your author career. Every spike, dip, and page read tells you something about how readers are discovering and engaging with your work.
Staying on top of your dashboard doesn’t mean obsessing over every number. It means:
- 🎯 Making informed decisions based on real reader behavior
- 🧭 Spotting opportunities to grow your reach and royalties
- ✍️ Spending less time guessing, and more time writing
When you learn to read your data like a narrative, not just numbers, you unlock a new kind of creative control.
And when you’re ready to push your story further?
Smart promos and ads can help you get more meaningful traffic to your Amazon page, so your dashboard starts telling the story you want to see.
👉 Want to see your KDP dashboard light up? Run a promo with Written Word Media today.
💬 Join the Conversation: What’s one thing your KDP dashboard has taught you about your readers or your writing? Share in the comments, we’re all ears (and charts).